|
Landslide tsunami scenario off of Palos Verdes, California Philip Watts, James V. Gardner, Ahmet C. Yalciner, Fumihiko Imamura, Costas E. Synolakis This web page reviews a landslide tsunami scenario in advance of publication in a peer reviewed scientific journal. The scenario considered here is both realistic and imminent. This landslide and its tsunami could occur at any time. The scenario is also considered to produce a typical local tsunami off of Southern California -- most coastal communities would experience waves of less than 2 m in amplitude. The scenario addresses the probable, in addition to the possible. The landslide tsunami scenario is funded in part by FEMA through a grant made to the University of Southern California, and in part by Applied Fluids Engineering, Inc.
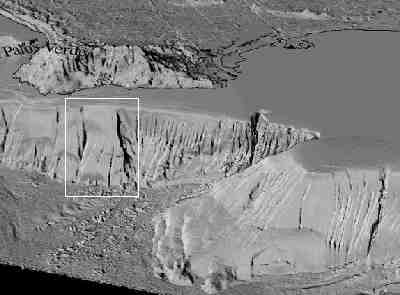
This is a 20x vertically exaggerated view of the sea floor off of Palos Verdes, Los Angeles County, California. The apparently vertical walls on the image are actually inclined between 5-20 degrees, which is extremely steep for submarine slopes, but much less than they appear on the image. To the immediate right of the white rectangle is the scar of a past landslide, several hundred years old. Some debris from this landslide probably litters the sea floor of the San Pedro Basin. The white rectangle indicates a region susceptible to landsliding during a local earthquake. Experience acquired on dry land suggests that an earthquake with magnitude >5 is needed to induce failure. However, a nearby earthquake will not always cause tsunamigenic landsliding. Only a tsunami warning system can avert false alarms by either detecting an underwater landslide or measuring the size of a tsunami. The dimensions of the landslide highlighted above are expected to be around:
These tsunami source characteristics were input into the software package TOPICS to calculate the tsunami shape about 3 minutes after landslide failure began. The tsunami generation time and tsunami period are both about 3 minutes in duration. TOPICS assumes catastrophic failure of the entire landslide. The tsunami source from TOPICS is approximate, yet captures those features needed to assess tsunami hazard.
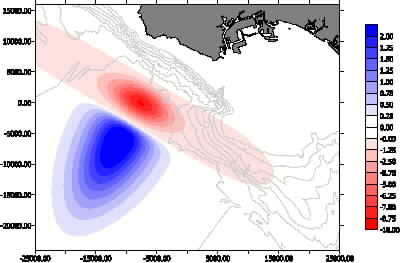
This contour plot maps the tsunami shape as input into the propagation code TsunamiN2 about 3 minutes after landslide failure began. Blue indicates an elevation wave while red indicates a depression wave. Note that the blue and red colors have different vertical scales. The tsunami propagation code TsunamiN2 simulates coastal tsunami attack and is the most tested and reliable tsunami propagation code in the world. A uniform grid size of 50 m was used for this numerical simulation. The simulation ran for 2.5 days on a Pentium III computer and had more than 10,000 time steps.
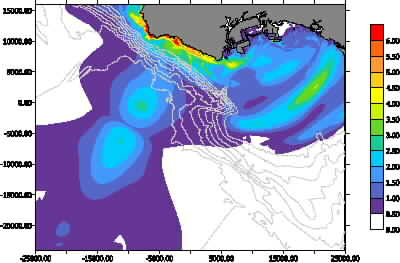
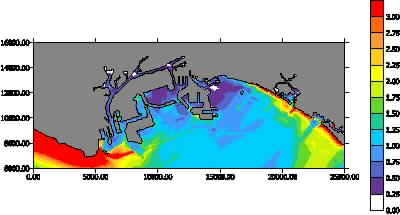
This plot summarizes the scenario results by providing the maximum tsunami amplitude encountered at each location and at any time during the simulation. It shows where the waves become large, and where the waves remain small. Almost all of the large wave amplitudes are restricted to the coastline of Palos Verdes. However, an underwater mound is also seen to focus tsunami waves onto Sunset Beach, located at the upper right hand side of the image. This tsunami would impact Orange County in addition to Los Angeles County.
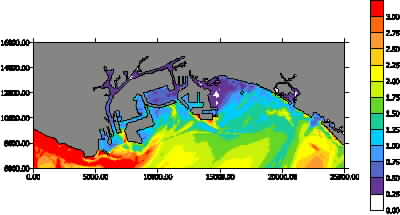
By changing color scale and enlarging the shoreline, maximum tsunami amplitudes can be discerned for the Ports of Los Angeles and Long Beach as well as the City of Long Beach. Waves up to 3 m above sea level attack the outer rim of the Ports. These waves arrive between 10-20 minutes after landslide failure. Waves up to 1.5 m are found to resonate within certain harbor basins for hours, in part because the tsunami period matches natural frequencies within the Ports. These waves are big enough to impact oil transfer and oil storage facilities, to break ships loose from their moorings, to dump containers into basins and channels, and to expose the Ports to a catastrophic fire. The wave amplitude increases significantly as it reaches shore along the Long Beach Peninsula, parts of Seal Beach, and most of Sunset Beach, in that order. Some shoreline properties would be partially inundated, others would experience severe wave damage.
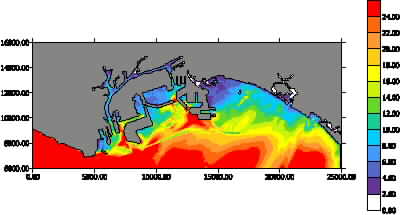
A plot of maximum water velocities indicates that ships would be subject to currents of one or more knots throughout large regions of the Ports. Ships that are not moored or anchored could be expected to travel several hundred meters laterally as the waves rebound within the Ports. Entrances to channels and basins experience the highest water velocities. Water velocity is also seen to increase near the shoreline of Long Beach Peninsula, Seal Beach, and Sunset Beach. Waves would be traveling faster than residents could run. However, these waves arrive at least 26 minutes after landslide failure, giving plenty of time to evacuate the beaches if a warning system indicated a landslide tsunami. This tsunami also attacks coastal communities with a leading depression wave, giving those who observe the sea recede several minutes to seek shelter.
The maximum water flux is a proxy for maximum water pressure in KiloPascals. Water pressure is responsible for damaging structures, including oil storage facilities and homes. This image shows the regions within the Ports and along the shoreline most susceptible to water damage. Note that some locations experience large amplitude waves or high water velocities without significant mass flux. These locations are more likely to be spared severe wave damage. To comment on this web site, please contact Dr. Philip Watts. |